Faculty of Computer Science News
» Go to news mainMaking life easier through Visualization and Machine Learning

Dr. Fernando Paulovich arrived at Dalhousie in 2017 to take up his position as a Tier 2 Canada Research Chair in the Faculty of Computer Science. Previously based at the University of São Paulo in São Carlos, Brazil, he brings with him two students and a lot of research questions.
Although the move meant leaving behind a well-established research lab in a large Faculty, he welcomes the opportunities here in Canada to make closer research collaborations with industry and to be part of a more stable research funding environment.
Solving day-to-day problems
Dr. Paulovich describes his research as Information Visualization and Visual Analytics. “Much of my work so far has been motivated by problems I encounter in my own life,” he says.
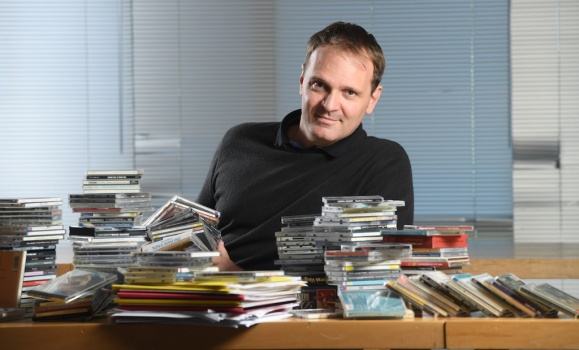
A music lover, he realized he had a personal collection of thousands of MP3s but only currently played a small selection, the remainder becoming forgotten over time. “The pieces of music that gradually slip into this forgotten space are no less valuable than those that are still being played, but it requires too much cognitive effort to retain an active awareness of all of them,” explains Dr. Paulovich.
Applying the tools of Visualization to this collection, Dr. Paulovich used machine learning to classify all of the pieces of music on a number of different parameters: genre, mood, gender, and intensity. He then created a visual interface to plot all of the pieces of music according to these parameters, with similar pieces of music occupying positions close to each other. It is then simple, for example, if you have been enjoying a song by Amy Winehouse, to be reminded of other adjacent songs in your collection that are similar.
“In this way, we can see the whole collection at once and be reminded through a straightforward visualization of other songs that would appeal to us in our current mood,” says Dr. Paulovich. “The visualization also enables the user to rotate the orientation of the parameters used in the multidimensional space so that any combination of parameters line up, grouping certain characteristics more definitely. So essentially, if you want to see all the sad songs by female vocalists you can line up the parameters and cluster them all together.”
Building a reputation in Canada
Such techniques could apply to many different media collections. Another area with direct personal relevance to Dr. Paulovich is research papers. Conducting a literature review is becoming more and more difficult due to the larger and larger volumes of papers and the increasing production rate of new papers related to any given topic. “Tools to organize such collections are increasingly needed,” he argues.
At Dalhousie, Dr. Paulovich is interested in investigating collections of data which evolve over time. He will be building up his research lab, recruiting new graduate students and making connections with other researchers and industry partners. In the long term, he is interested in such problems as how to extract answers to common sense questions from the massive amounts of data available through search engines such as Google.
“If you want to decide whether or not to move from Brazil to Halifax there should be a simpler way to access the whole knowledge base and get a reliable answer based on the parameters that are important to you,” Dr. Paulovich says. “However, that might take some time!”
Recent News
- Beyond the books: This year's Dalhousie Impact Awards winners lead with purpose
- Where experience meets impact: Introducing Dalhousie’s 2023 Top Co‑op Students of the Year
- Alicia Wong: Empowering Women in Tech through Mentorship
- On International Women’s Day, an opportunity to reflect on the state of gender equity in academia
- Dal's 2024 OpenThinkers forge new frontiers in research
- Building community connections for Women in STEM
- Dal builds momentum in Nova Scotia’s growing ocean‑tech sector with new role
- Snowball Gala celebrates the computer science community
